
Bitcoin (BTC) Signals for 48% Upside With Target at $61,000


In today’s long-term analysis of the Bitcoin (BTC) price, we look at the 5-day chart and its associated technical indicators: the BBWP and the Stochastic RSI. Over the past year, their combination has several times provided a signal for a significant move in the BTC price – on average 48% up or down.
It turns out that also today’s price action combined with the values of the indicators on the 5-day time frame gives conditions similar to historical signals of a strong Bitcoin move. Recently, well-known cryptocurrency analyst Eric Krown took a look at this development on YouTube. If the market behaves like it has for the past 12 months, the BTC price could reach the $61,000 area in about 42.5 days.
BTC price action
Bitcoin reached the all-time high (ATH) of $69,000 on November 10, 2021. After that, the price declined for the next 75 days to reach a bottom at $33,000 on January 24, 2022. BTC has dropped 52% since the ATH.
Since the January bottom, BTC has been in a sideways trend, with the price consolidating and higher lows appearing on the daily chart. For the last month and a half, Bitcoin has been in a fairly well respected range between $37,500 and $44,500.
If we look at BTC’s price action over the past 12 months, we can see some similarities to the trend reversal that followed the summer 2021 macro low. Back then, Bitcoin seemed to be looking for a bottom and then increasing along a rising curve.
It initially set support points (green circles) during the May-July 2021 low, and then also served as support during the September correction. Only a decisive breakdown below this curve and its confirmation as resistance on November 12-15 initiated a sharp decline of BTC.
In the current market situation, we see a similar rising curve that seems to have been in place since the December 4 low. The combination of the local lows of the BTC price (blue circles) gives a curve with a similar structure and slope as the 2021 curve. If the support line it sets is held, which is rising faster and faster, Bitcoin may soon experience exponential growth.
Bitcoin volatility drops: BBWP reaches bottom
The Bollinger Band Width Percentile (BBWP) is a derivative of the Bollinger Band indicator. The latter is a volatility-based indicator. It consists of three lines that are plotted in relation to the price of an asset. The middle line is usually a simple moving average. While the upper and lower bands are usually 2 standard deviations above and below the middle line.
The BBWP shows the percentage of bars in a specific time interval where the Bollinger Band width was less than the current Bollinger Band width. In other words, the BBWP shows a chart of the volatility of an asset in relation to its previous price movements.
On the 5-day BBWP chart for Bitcoin over the past year, we see an interesting pattern. Since January 2021, the BBWP has been behaving like an oscillator that periodically bottoms out at a level of several percent. Bitcoin’s volatility is falling. Such situations have occurred 4 times so far (vertical blue lines):
May 6, 2021 – BBWP at 11%July 25, 2021 – BBWP at 18%October 3, 2021 – BBWP at 15%December 2, 2021 – BBWP at 16%

Each of these lows on the BBWP chart was followed within days by a phase of rapid expansion in Bitcoin’s volatility. The next few days always led to big ups or downs, as volatility is directionally neutral. It simply signals a big change in the price.
Moreover, the BBWP chart itself seems to respect the falling resistance line. Each successive rise in volatility is smaller than the previous one. This indicates a global decline in Bitcoin’s volatility over the past year.
At the same time, it signals that we can expect a very strong move in BTC over the next few months when the BBWP resistance line is broken through. This is another signal in favor of the thesis that the last year has been a time of macro consolidation for Bitcoin.
Bitcoin is about to rise (or fall) by 48%
Now, looking at the price action in the periods immediately following the consecutive lows on the BBWP, we can see the range of corresponding increases and decreases. Measuring the movement of the BTC price from the 5-day candle opening at the time of the signal to the local high/low, we get the following results:
50% decline that lasted 45 days55% increase that lasted 40 days45% increase that lasted 35 days42% decline that lasted 50 days

Averaging these data, we get an average volatility of 48% for the Bitcoin price. On the other hand, the average duration of the move from signal to high/low is at 42.5 days.
The most recent 5-day candle has an opening price of $41,100. If the average time to the next high/low is maintained, the target will be reached in the last days of April. If this were to be a 48% increase from the opening candle, BTC would be priced near $61,000. If it was a 48% decline, then BTC would be priced around $21,400.
If volatility is directionally neutral, how can we estimate the chance of which way the market will go? Also, analyzing the bottom signal on BBWP for the past year gives a 2:2 ratio between the number of increases and decreases, or 50% each way.
One hint is the rising curve mentioned in the first section, which seems to serve the Bitcoin price as support. Another is that the signal comes after a 52% correction from the ATH. This does not mean that BTC cannot fall another 48%. However, the situation may slightly argue for an upward move as the selling pressure may soon be exhausted.
Stochastic RSI: Upside is more likely
However, we seem to be getting the strongest signal in favor of a higher chance of upside from another indicator: Stochastic RSI (StochRSI). It is derived from the Relative Strength Index (RSI), which is a fundamental momentum indicator and shows on a scale of 0-100 whether an asset is overbought or oversold.
The Stochastic RSI uses the same scale, but applies the stochastic oscillator formula to the RSI values rather than the underlying price data. This results in a much more responsive oscillator that moves more quickly from overbought (above 80) to oversold (below 20) and vice versa.
Now superimposing the data from the BBWP bottom signal periods onto the 5-day StochRSI chart, we get additional insight into the possible direction of Bitcoin’s movement. It turns out that in the historical cases we analyzed, the StochRSI data may have helped to better determine the direction of the potential move. The highlighted areas (red circles) consecutively correspond to:
50% decline after May 6 – StochRSI unsuccessfully trying to break out from oversold area55% rise after 25 July – StochRSI sharply breaks out from oversold area45% rise after October 3 – StochRSI temporarily reaches neutral territory and turns back towards overbought area42% decline after December 2 – StochRSI falls sharply towards oversold area
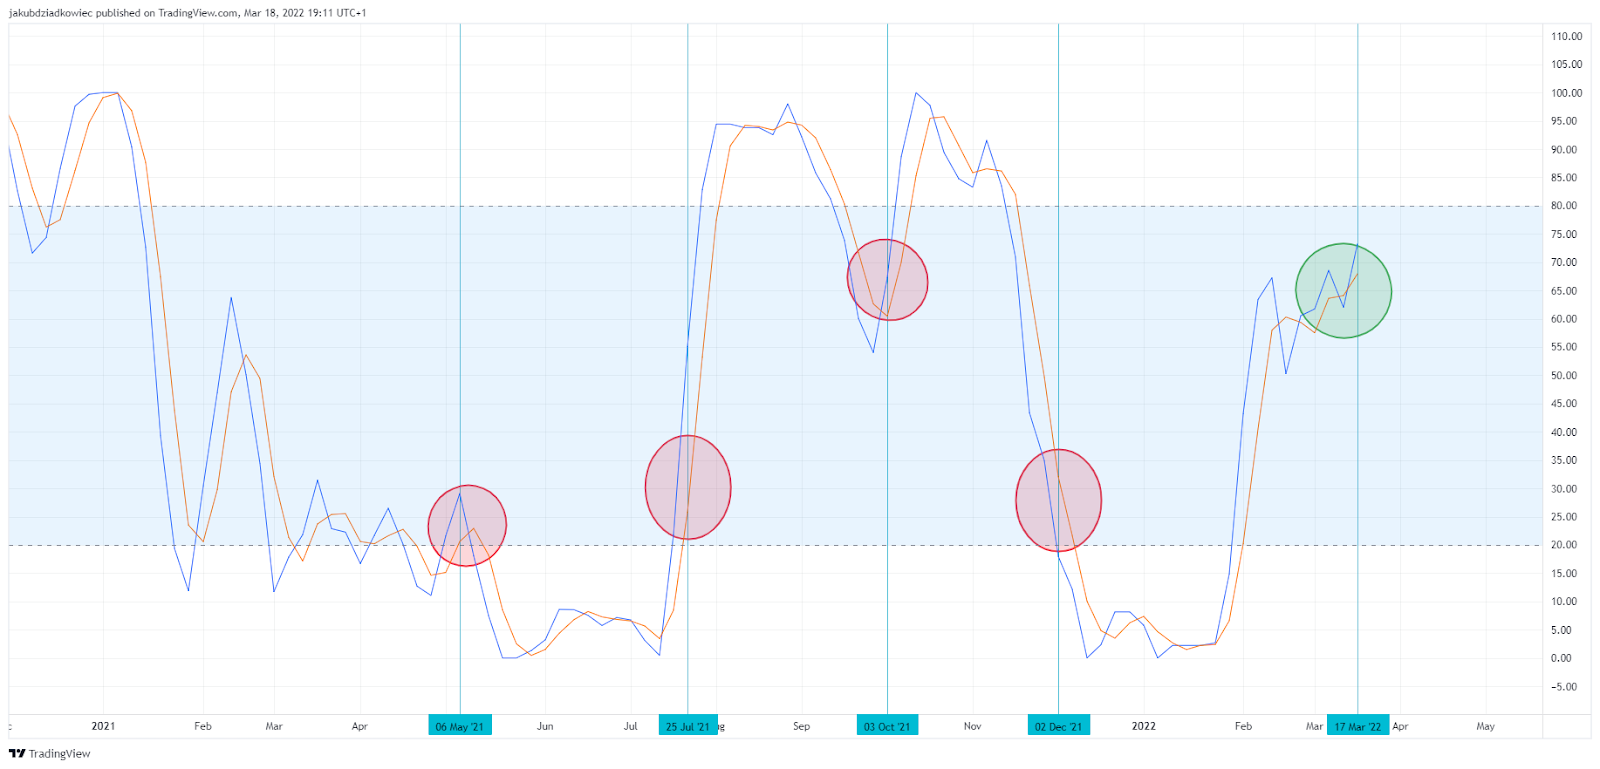
In this perspective, how does the situation on the StochRSI chart look today (green circle)? The chart has rapidly broken out of the oversold area and is rising. Moreover, the StochRSI had several opportunities to bounce from neutral territory and break down towards the oversold area. However, this did not happen, and the chart generated another positive momentum signal and is heading upwards.
This happened in a similar area (around 65) as around October 3. At that time, the Bitcoin price also moved north. If a sharp sell-off does not occur, the StochRSI will continue to head upwards towards the overbought area. This increases the likelihood of a dynamic upward move in BTC.
Conclusion
The technical indicators on the 5-day time frame give signals that a big move in the BTC price is coming, which may be directed towards the upside. Such a conclusion is obtained by combining the BBWP volatility indicator with the StochRSI momentum indicator.
An additional argument is the rising support curve on the Bitcoin price chart, which shows structural similarities with a trend reversal after the 2021 summer low. If BTC rises significantly from the date the signal was generated, Bitcoin can be expected to be around $61,000 by the end of April.
For BeInCrypto’s previous Bitcoin (BTC) analysis, click here.
Disclaimer
All the information contained on our website is published in good faith and for general information purposes only. Any action the reader takes upon the information found on our website is strictly at their own risk.
Source link


best crypto signals
Bitcoin (BTC) Signals for 48% Upside With Target at $61,000 – Crypto-Kid