
Bitcoin Price Prediction for Today, May 2: BTC Retraces Below $39,000

The Bitcoin price prediction indicates bearish momentum as the coin fails to cross above the 9-day and 21-day moving averages.
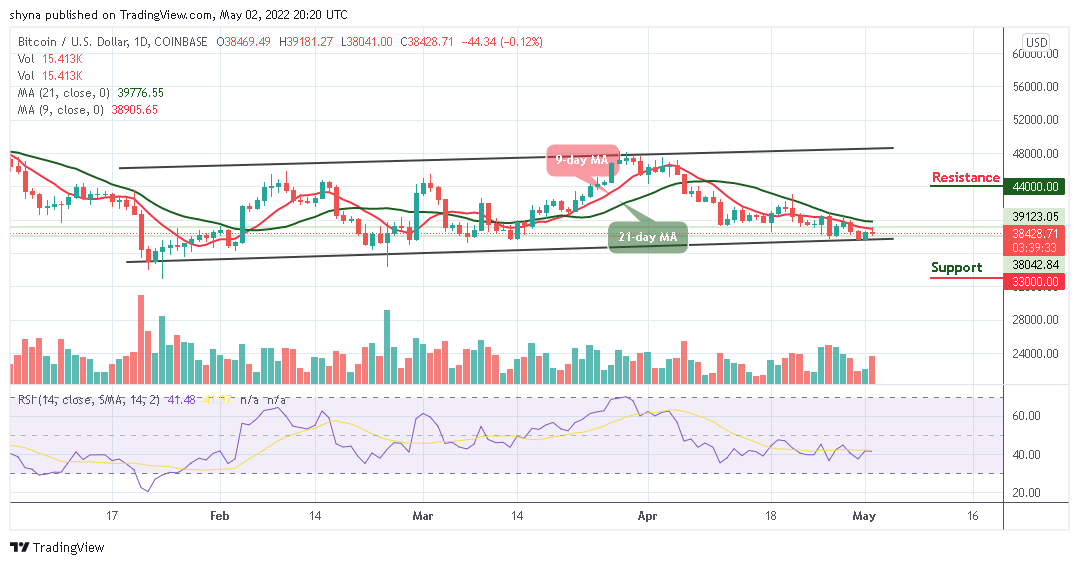
BTC/USD Long-term Trend: Ranging (Daily Chart)
Key levels:
Resistance Levels: $44,000, $46,000, $48,000
Support Levels: $33,000, $31,000, $29,000
According to the daily chart, BTC/USD hovers at $38,428. However, the king coin has not been able to reclaim the resistance level of $40,000 as the coin consolidates below the 9-day and 21-day moving averages. At the moment the Bitcoin price may continue to follow the sideways movement, but the daily chart shows that the formation of a bearish movement is likely to play out.
Bitcoin Price Prediction: BTC Price May Consolidates to the Downside
As the Bitcoin price remains below the 9-day and 21-day moving averages, BTC/USD is likely to cross below the lower boundary of the channel as the technical indicator Relative Strength Index (14) moves in the same direction below the 50-level. This could mean that the King coin is not yet ready for the upside until the red line of the 9-day moving average crosses above the green line of the 21-day moving average.
From above, recovery may not come easy as the bears may bring the king coin below the upper boundary of the channel. Meanwhile, a sustainable move above the 9-day and 21-day moving averages may locate the resistance level of $40,000, which may allow for an extended recovery towards the potential resistance levels at $44,000, $46,000, and $48,000. However, an increase in selling pressure may bring the Bitcoin price towards the supports at $33,000, $31,000, and $29,000.

BTC/USD Medium-Term Trend: Bearish (4H Chart)
Looking at the 4-hour chart, the Bitcoin price is trading within the 9-day and 21-day moving averages. BTC/USD may cross above 9-day MA as the market is trying to recover from the bearish momentum. However, if the price breaks above the 9-day moving average and crosses above the upper boundary of the channel, higher resistance would be located at $39,000 but on the contrary, the technical indicator Relative Strength Index (14) is seen facing the south.
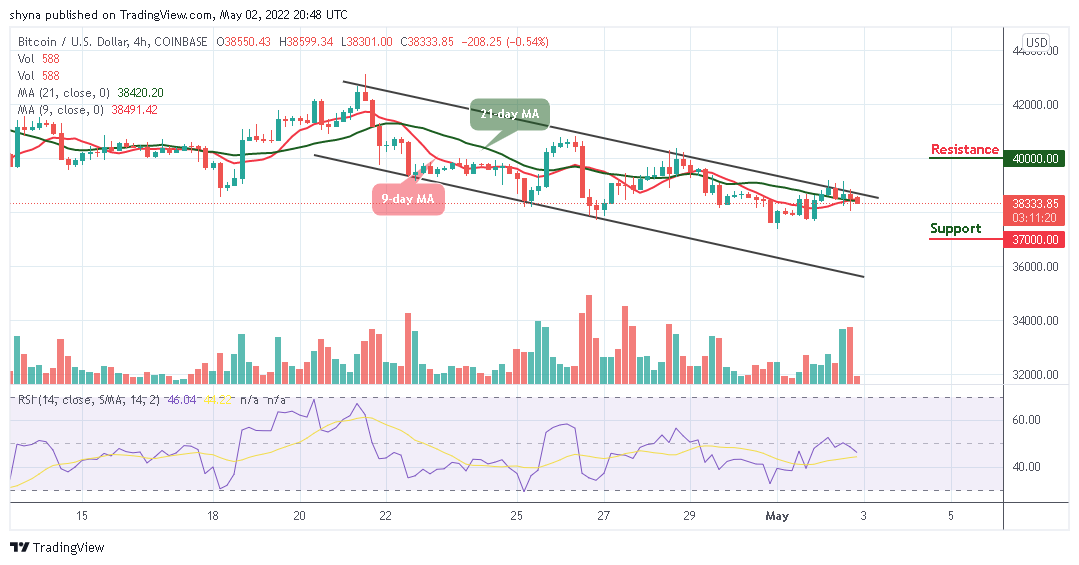
Moreover, if the bearish movement steps back, the support level of $38,000 may not be able to hold the selling pressure. Therefore, BTC/USD is likely to fall to $37,000 and below if the price moves towards the lower boundary of the channel.
Looking to buy or trade Bitcoin (BTC) now? Invest at eToro!
68% of retail investor accounts lose money when trading CFDs with this provider
Read more:
Source link


Comments are closed.