
BTC Retraces Above $40,000 Level


The Bitcoin price prediction trades above the resistance level of $40,000 as the coin heads toward the 9-day moving average.
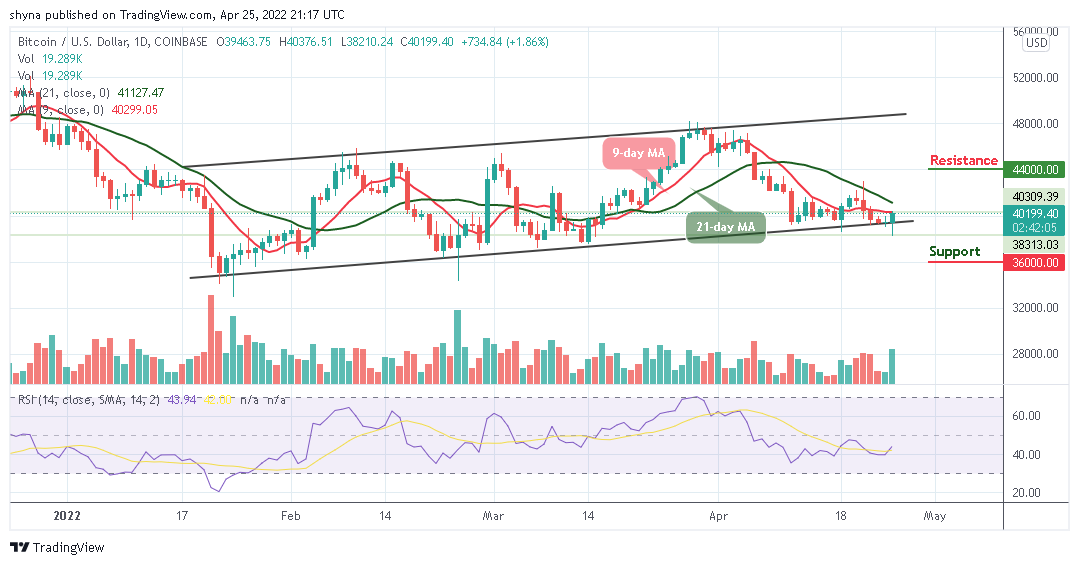
BTC/USD Long-term Trend: Ranging (Daily Chart)
Key levels:
Resistance Levels: $44,000, $46,000, $4,000
Support Levels: $36,000, $34,000, $32,000
BTC/USD is likely to stay above $40,000 as the bulls may struggle to push the coin to higher levels above the 9-day and 21-day moving averages. However, for the Bitcoin price to remain above this barrier, the bulls need to make the $39,000 support level to be pretty strong.
Bitcoin Price Prediction: BTC/USD May Begin to Move Higher
The Bitcoin price is yet to cross above the 9-day and 21-day moving averages, but the king coin may be settling in a tight range below the 9-day and 21-day moving averages. In addition, this current session is seeing Bitcoin and other major cryptos exchanging in a good tone. Meanwhile, the Bitcoin price and the daily candle are trading at $40,199 below the moving averages. The next resistance levels may be located at $44,000, $42,000, and $40,000.
However, if the Bitcoin price failed to cross above the 9-day and 21-day MAs; traders may see a price cut below the lower boundary of the channel at $39,000 vital support. Therefore, a further low drive could send the price to $36,000, $34,000, and $32,000 supports. For now, the Relative Strength Index (14) is moving above the 40-level, suggesting a bullish signal in the market.

BTC/USD Medium-Term Trend: Ranging (4H Chart)
Looking at the 4-hour chart, BTC/USD is hovering above the 9-day and 21-day moving averages. A successful close above this barrier is a must for bullish acceleration. If not, there is a risk of a downside extension below the $40,000 support. If there is a downward move, the main support is near the $38,500 and below.
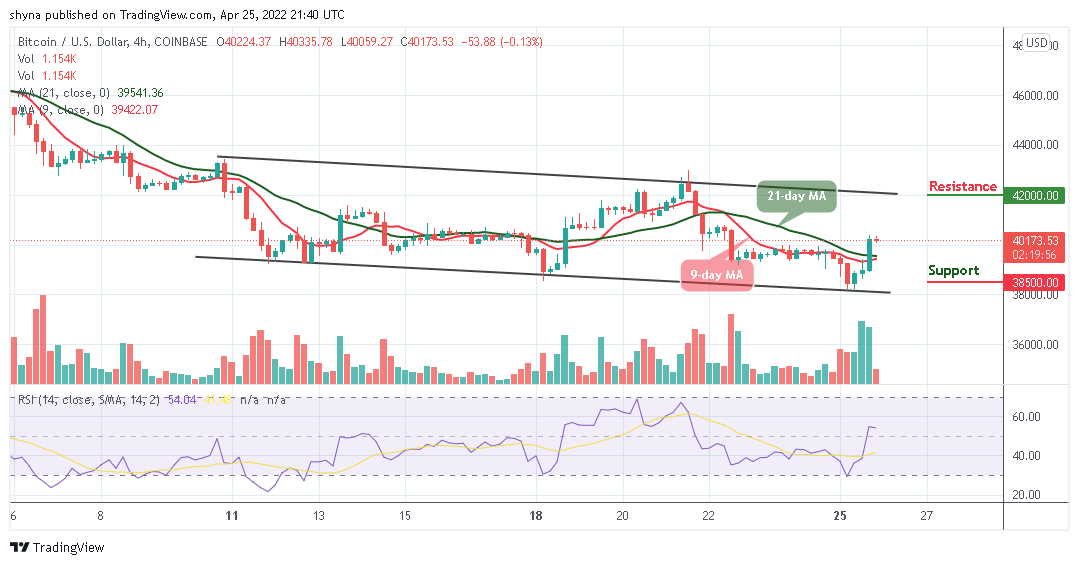
However, if the bulls push the coin towards the upper boundary of the channel, the $41,000 level is likely to act as a major hurdle in the near term for Bitcoin. So if there is an upside break above the channel, the next stop for the bulls may perhaps be near the $42,000 and above as the Relative Strength Index (14) moves above 50-level, which indicates sideways movement.
Looking to buy or trade Bitcoin (BTC) now? Invest at eToro!
68% of retail investor accounts lose money when trading CFDs with this provider
Read more:
Source link


Comments are closed.