
BTC Risks Fresh Drop Below $29,000 Support


The Bitcoin price prediction reveals that BTC is yet to gain strength above the moving averages as the coin shows a few bearish signs.
Bitcoin Prediction Statistics Data:
Bitcoin price now – $29,719
Bitcoin market cap – $566.2s billion
Bitcoin circulating supply – 19.04 million
Bitcoin total supply – 19.04 million
Bitcoin Coinmarketcap ranking – #1
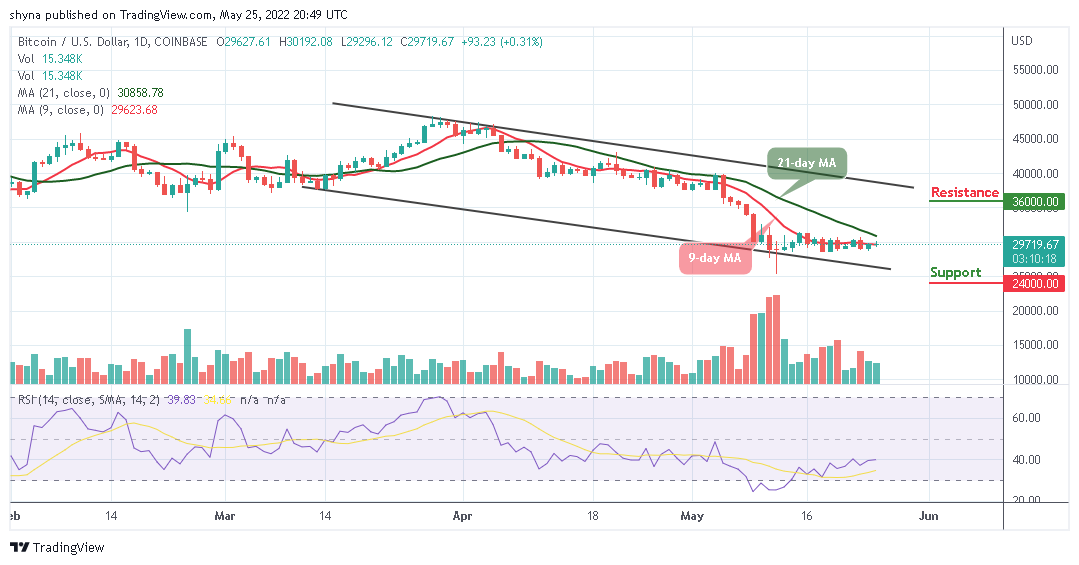
BTC/USD Long-term Trend: Bearish (Daily Chart)
Key levels:
Resistance Levels: $36,000, $38,000, $40,000
Support Levels: $24,000, $22,000, $20,000
After another failure to hit the $30,000 resistance, BTC/USD remains below the 9-day and 21-day moving averages and the coin could begin another decline if bulls failed to push it above the moving averages. At the opening of today’s trading; the touches the resistance level of $30,192, but any further bearish movement may keep the coin within the bearish zone.
Bitcoin Price Prediction: Would Bitcoin (BTC) Head to Upside?
As the Bitcoin price hovers below the 9-day and 21-day moving averages, moving towards the lower boundary of the channel may begin to show bearish signs. More so, if there are more losses, the price could break the major supports at $24,000, $22,000, and $20,000. Meanwhile, the technical indicator Relative Strength Index (14) is likely to move above the 40-level to increase the bullish movement.
On the other hand, if the king coin crosses above the moving averages; it could begin a bullish movement. Moreover, the main resistance could be located around the $30,000 level, and a clear break above this level may push the price towards the resistance levels of $36,000, $38,000, and $40,000.
BTC/USD Medium-Term Trend: Ranging (4H Chart)
According to the 4-hour chart, BTC/USD may cross above the 9-day and 21-day moving averages to hit the resistance level of $30,000. At the moment, the volatility still hovers, and the selling pressure exists, which could lead the coin not to be able to cross above the upper boundary of the channel. Meanwhile, the $28,500 and below may come into play if BTC breaks below the lower boundary of the channel.
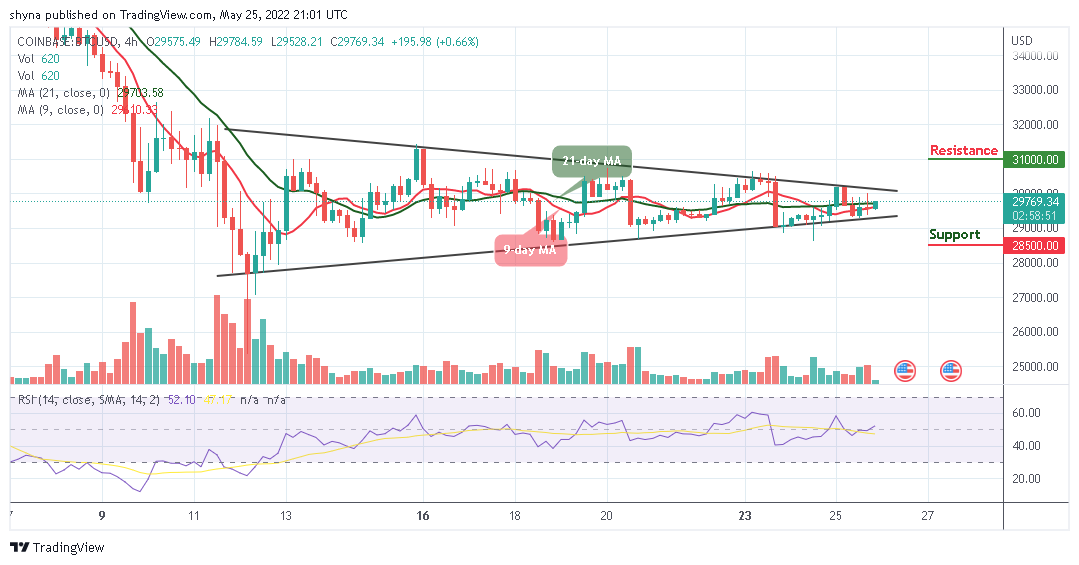
However, if the buyers can still reinforce and power the market, traders can expect a retest at a $30,500 resistance level, and breaking this level may further allow the bulls to reach the resistance level of $31,000 and above. The Relative Strength Index (14) is crossing above the 50-level, which shows that more bullish signals may continue to play out.
Looking to buy or trade Bitcoin (BTC) now? Invest at eToro!
68% of retail investor accounts lose money when trading CFDs with this provider
Read more:
Source link


Comments are closed.