
BTC/USD Could Experience Another Drop Below $23,500


Join Our Telegram channel to stay up to date on breaking news coverage
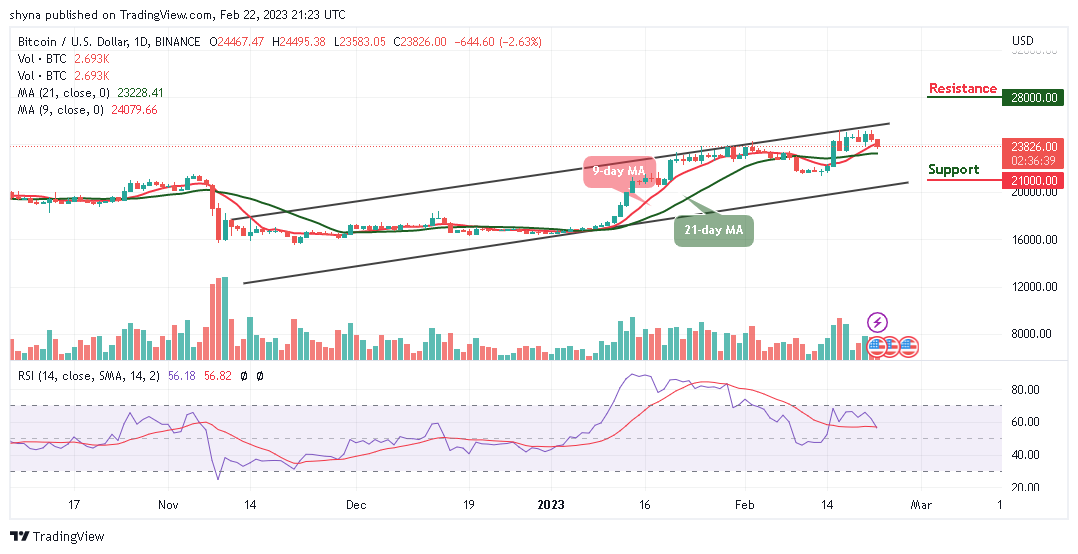
The Bitcoin price prediction reveals that BTC is yet to gain strength above the resistance level of $25,000 as the coin ranges.
Bitcoin Prediction Statistics Data:
Bitcoin price now – $23,826
Bitcoin market cap – $458.89 billion
Bitcoin circulating supply – 19.2 million
Bitcoin total supply – 19.2 million
Bitcoin Coinmarketcap ranking – #1
BTC/USD Long-term Trend: Bullish (Daily Chart)
Key levels:
Resistance Levels: $28,000, $29,000, $30,000
Support Levels: $21,000, $20,000, $19,000
After another failure to cross above the resistance level of $25,000; BTC/USD is seen sliding below the 9-day moving average. Therefore, the Bitcoin price could begin another decline if bulls failed to push the coin to the upside. At the opening of today’s trading; the king coin touches the resistance level of $24,495 but begins to bring the coin below the 9-day moving average.
Bitcoin Price Prediction: Bitcoin (BTC) May Head to the South
As the Bitcoin price hovers within the moving averages, heading toward the lower boundary of the channel may increase the selling pressure. Therefore, if there are more losses, the price could break the major supports at $21,000, $20,000, and $19,000. Meanwhile, the technical indicator Relative Strength Index (14) moves in the same direction around the 40-level, suggesting sideways movement.
On the other hand, if the king coin crosses above the 9-day moving average; it could head towards the upper boundary of the channel and a clear break above this barrier may cause the coin to the resistance levels of $28,000, $29,000, and $30,000.
BTC/USD Medium-term Trend: Ranging (4H Chart)
According to the 4-hour chart, the coin may gain lost momentum if the coin moves to cross above the upper boundary of the channel. At the moment, the volatility still hovers, and the selling pressure still exists as this could lead the coin to the downside. Meanwhile, the $22,000 and below may come into play if BTC breaks below the lower boundary of the channel.
Meanwhile, if the buyers can reinforce and power the market, traders can expect a bullish movement toward the upper boundary of the channel, and breaking this barrier may allow the bulls to reach the resistance level of $26,000 and above. However, the Relative Strength Index (14) is likely to cross above the 40-level, which shows that the market could follow the bullish movement.
Bitcoin Alternatives
The Bitcoin price is likely to resume an upward move as it retests the previous low but if the bulls fail to break the resistance level of $25,000, the market may be compelled to a range-bound movement below the 21-day moving average. Meanwhile, there has been a rebounding buzz around the Fight Out (FGHT) token in the last few weeks. Quite a number of crypto enthusiasts have become endeared to the trajectory of the crypto project. In the ongoing presale, almost $5 million has been raised so far.
Fight Out (FGHT) – Move to Earn in the Metaverse

CertiK audited & CoinSniper KYC Verified
Early Stage Presale Live Now
Earn Free Crypto & Meet Fitness Goals
LBank Labs Project
Partnered with Transak, Block Media
Staking Rewards & Bonuses
Join Our Telegram channel to stay up to date on breaking news coverage
Source link


Comments are closed.