
BTC/USD Falls Below $20,500; Is that all for Bulls?


Join Our Telegram channel to stay up to date on breaking news coverage
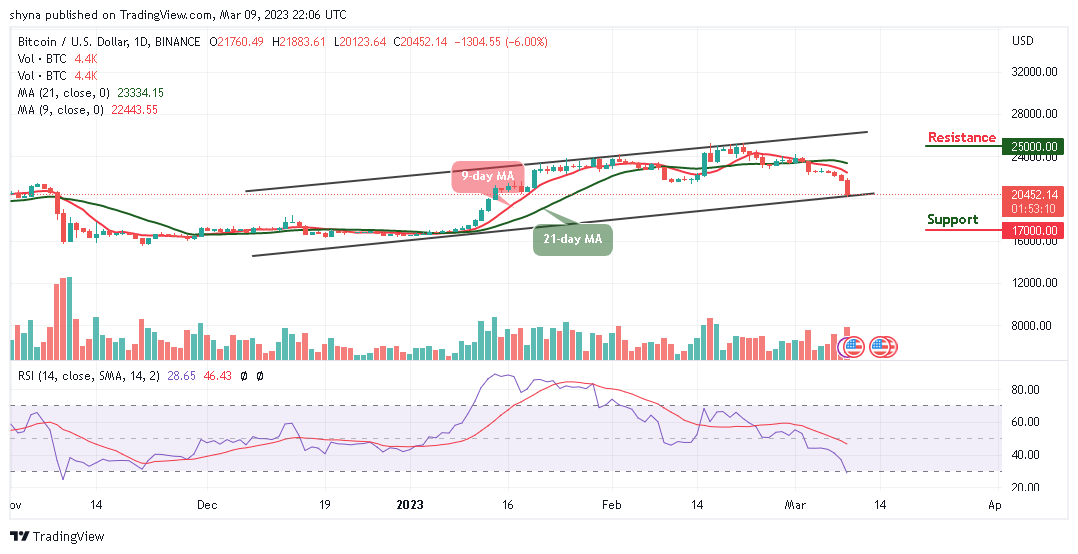
The Bitcoin price prediction reveals that BTC continues to head to the downside as its price moves below $21,000 to touch the low of $20,123.
Bitcoin Prediction Statistics Data:
Bitcoin price now – $20,452
Bitcoin market cap – $393.8 billion
Bitcoin circulating supply – 19.2 million
Bitcoin total supply – 19.2 million
Bitcoin Coinmarketcap ranking – #1
BTC/USD Long-term Trend: Ranging (Daily Chart)
Key levels:
Resistance Levels: $25,000, $27,000, $29,000
Support Levels: $17,000, $15,000, $13,000
BTC/USD is trading around $20,452 below the 9-day and 21-day moving averages. Looking at the daily chart, Bitcoin (BTC) has remained in a bearish zone, and it is likely to slide below the lower boundary of the channel to touch the support of $20,000. The king coin is now plunging below the former resistance level of $21,500 which may cause many investors to take profits off the table.
Bitcoin Price Prediction: Would Bitcoin (BTC) Break More Downs?
The Bitcoin price is currently changing hands at $20,452, however, where BTC trends next may partly depend on whether or not buyers can close today’s candle above the $21,000 level. Should in case this comes to play, the bulls may propel prices higher, and then traders may expect the king coin to rise above the 9-day and 21-day moving averages, which could later move toward the potential resistance levels at $25,000, $27,000, and $29,000.
On the other hand, if the Bitcoin price failed to close above the $21,000 level; the price could drop below the lower boundary of the channel and a low drive could send the price to the supports at $17,000, $15,000, and $13,000. Meanwhile, the technical indicator Relative Strength Index (14) also confirms the bearish movement as the signal lines move to cross into the oversold region.
BTC/USD Medium-term Trend: Ranging (4H Chart)
Looking at the 4-hour chart, BTC/USD is trading below the 9-day and 21-day moving averages. Looking at it from above, if Bitcoin holds above $21,000, then the next level of resistance could be $22,000, along with the significantly mentioned ascending trend-line. The next resistance could be $23,000 and above.
Meanwhile, as the technical indicator nosedives, if the coin falls below the lower boundary of the channel, the market price could reach the support level of $18,000 and below.
Bitcoin Alternatives
The Bitcoin price resumes a downtrend as it breaks below the crucial support level of $21,000. The king coin may continue the selling pressure as it approaches the lower boundary of the channel. However, if the bears break below the channel, Bitcoin could decline and revisit the previous low at $20,000. On the contrary, Fight Out is an M2E fitness app and a gym chain that gamifies and promotes a healthy way of living. The users will receive rewards and badges for completing the in-app challenges and workouts, as well as by taking part in player-vs-player fitness challenges and games. Meanwhile, in the ongoing presale, almost $5.5 million has been raised.
Fight Out (FGHT) – Move to Earn in the Metaverse

CertiK audited & CoinSniper KYC Verified
Early Stage Presale Live Now
Earn Free Crypto & Meet Fitness Goals
LBank Labs Project
Partnered with Transak, Block Media
Staking Rewards & Bonuses
Join Our Telegram channel to stay up to date on breaking news coverage
Source link


Comments are closed.