
BTC/USD Heads to the South; Price Could Hit $22k Support


Join Our Telegram channel to stay up to date on breaking news coverage
The Bitcoin price prediction loses traction as the coin heads to the south; losses are likely to continue in the near term.
Bitcoin Prediction Statistics Data:
Bitcoin price now – $22,462
Bitcoin market cap – $431.5 billion
Bitcoin circulating supply – 19.2 million
Bitcoin total supply – 19.2 million
Bitcoin Coinmarketcap ranking – #1
BTC/USD Long-term Trend: Ranging (Daily Chart)
Key levels:
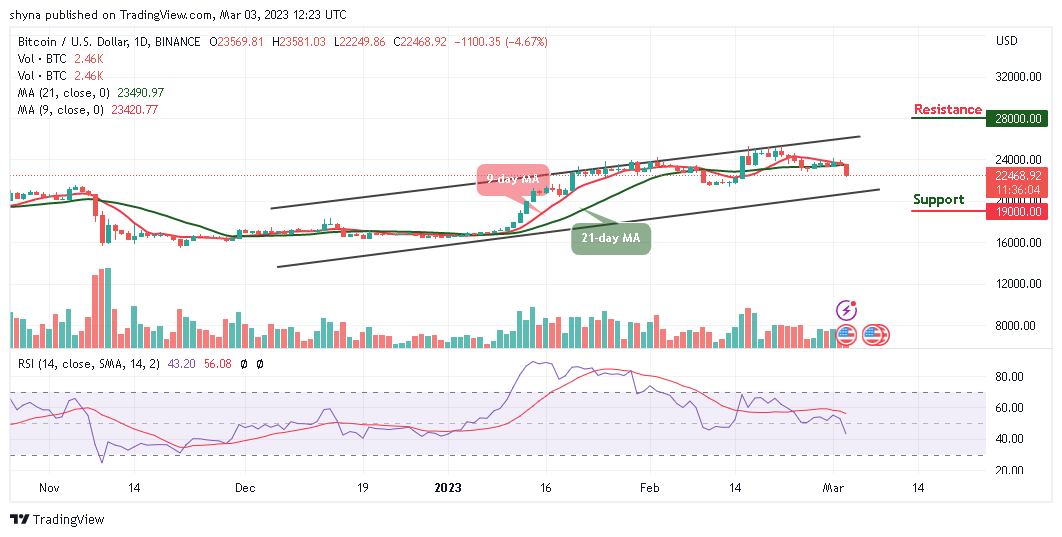
Resistance Levels: $28,000, $30,000, $32,000
Support Levels: $19,000, $17,000, $15,000
Since the past few days, traders can easily see that BTC/USD is back in the red zone posting major losses of 4.67% on the day after commencing trading at $23,569. However, the market movement has an intraday high of $23,581; although the world’s largest crypto touches the support level of $22,249 before going back to where it is currently trading at $22,468.
Bitcoin Price Prediction: The Bitcoin Price Could Plunge More
The Bitcoin price keeps moving toward the support level of $22,000, marking $22,249 as the current daily low at the moment. Does this mean that Bitcoin (BTC) could be searching for a new low? As the daily volume candle supports the bears, together with the 9-day moving average crossing below the 21-day moving average, it can be assumed that a stronger bearish movement may surface within the market.
At the time of writing, BTC/USD is struggling to maintain the $25,000 resistance level as the coin continues with the downward trend, the technical indicator Relative Strength Index (14) crosses below the 50-level, and the next support may come at $19,000, $17,000, and $15,000. On the contrary, if the coin moves above the moving averages, any further movement could face the lower boundary of the channel, but any bullish movement may hit the resistance levels at $28,000, $30,000, and $32,000.
BTC/USD Medium-term Trend: Bearish (4H Chart)
On the 4-Hour chart, the Bitcoin price is hovering below the 9-day and 21-day moving averages which could create a new low. Meanwhile, should the bulls gather enough strength and cross above the 9-day and 21-day moving averages; the upward movement may be able to near the resistance level of $23,500 and above.
On the downside, immediate support could be located below the lower boundary of the channel which could hit the main support at the $22,000 level. The price may likely fall furthermore and move towards the critical support level at $21,500 and below if the bears put more pressure on the market, and the Relative Strength Index (14) may remain within the oversold region.
Bitcoin Alternatives
According to the daily chart, the Bitcoin price touches the daily low of $22,249 but could move above the resistance level of $24,000 if the bulls return to the market. Moreover, should the price drop below the $22,000 support, it could create more bearish signals. Nonetheless, for FGHT to continue performing well, the project will need to adapt and stay relevant because the market could experience significant growth or disruption. This includes continuing to develop the platform and attracting a strong user base. In addition, the overall state of the market will also play a role in the price of FGHT as almost $5.5m has been made in the presale.
Fight Out (FGHT) – Move to Earn in the Metaverse

CertiK audited & CoinSniper KYC Verified
Early Stage Presale Live Now
Earn Free Crypto & Meet Fitness Goals
LBank Labs Project
Partnered with Transak, Block Media
Staking Rewards & Bonuses
Join Our Telegram channel to stay up to date on breaking news coverage
Source link


Comments are closed.