
BTC/USD Holds Price Above $57,000


Bitcoin Price Prediction – November 19
The Bitcoin price prediction shows that BTC is struggling to hold above the $58,000 but overhead selling pressure continues to push it down.
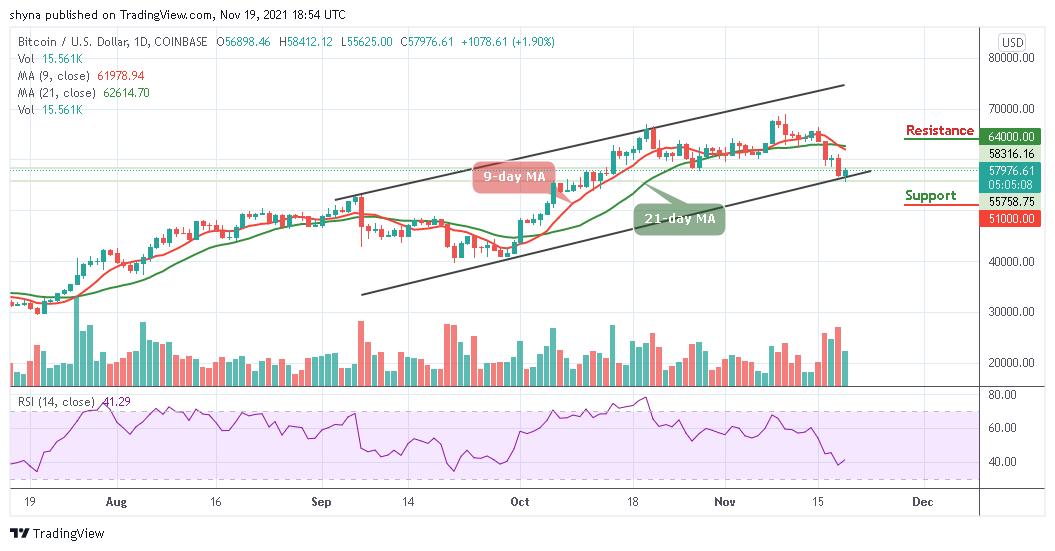
BTC/USD Long-term Trend: Ranging (Daily Chart)
Key levels:
Resistance Levels: $64,000, $66,000, $68,000
Support Levels: $51,000, $49,000, $47,000
At the time of writing, BTC/USD is likely to seek support above $55,000 to avoid extending the bearish leg to $53,000. The trend-line of the lower boundary of the channel is also a key level in the mission to avert the losses, perhaps reverse the trend for gains heading to $58,000. Alternatively, the BTC bulls need to find acceptance above the intraday highs of $58,412 to refuel the recovery momentum.
Bitcoin Price Prediction: Bitcoin Price May Dip Below $55k
The Bitcoin price is stable above $50,000 as it is currently attempting to keep the market price above $55,000. Meanwhile, BTC/USD is slowly moving higher towards the $58,000 resistance level. Crossing above the 9-day and 21-day moving averages may reach the next key resistance level at 60,000, above which the bulls are likely to hit the potential resistance at $64,000, $66,000, and $68,000 in the near term.
On the other hand, if there is no clear break above $55,000, there are chances of a fresh decline. However, if the 9-day MA crosses below the 21-day MA, the coin may enter into the negative side and the initial support is near the $53,000 level. The main support could then form below the lower boundary of the channel which could cause the king coin to dive towards the supports of $51,000, $49,000, and $47,000 as the technical indicator Relative Strength Index (14) remains above 40-level.

BTC/USD Medium – Term Trend: Bearish (4H Chart)
On the 4-hour chart, a retest of $58,412 gives the impression that the bulls are not yet done. The Bitcoin price may rise to cross above the 21-day moving average which may take the coin towards the $60,000. In a short time, BTC/USD may hit $59,000 if the bullish pressure continues. Otherwise, the price may revisit the support of $55,000 and below.
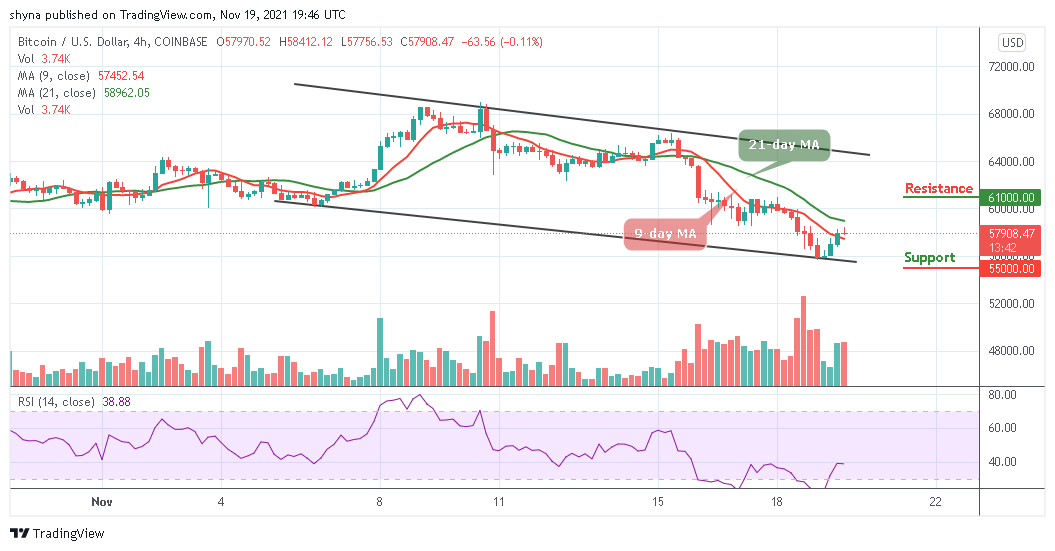
On the upside, a bullish move may hit the resistance at $61,000 and above. As of now, the Relative Strength Index (14) is moving around 40-level, this could mean that BTC/USD may be looking for another close support. Meanwhile, a significant cross below the 9-day moving average may send the market in a bearish scenario.
Looking to buy or trade Bitcoin (BTC) now? Invest at eToro!
68% of retail investor accounts lose money when trading CFDs with this provider
Read more:
Source link