
BTC/USD May Consolidate Above $24,000


Join Our Telegram channel to stay up to date on breaking news coverage
The Bitcoin price prediction is currently consolidating and seems to be preparing for the next move above the resistance level of $24,000.
Bitcoin Prediction Statistics Data:
Bitcoin price now – $23,484
Bitcoin market cap – $453.2 billion
Bitcoin circulating supply – 19.2 million
Bitcoin total supply – 19.2 million
Bitcoin Coinmarketcap ranking – #1
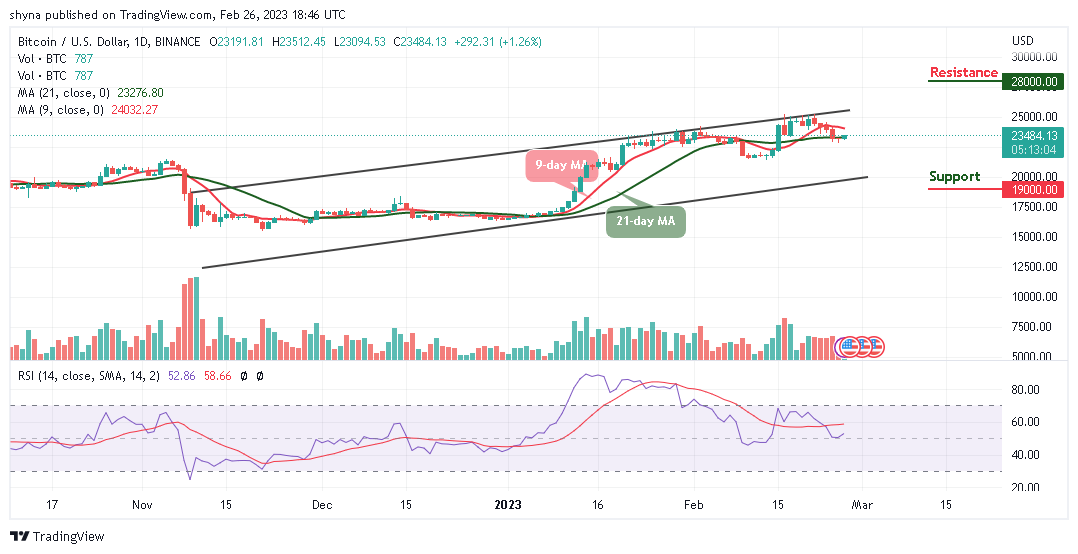
BTC/USD Long-term Trend: Ranging (Daily Chart)
Key levels:
Resistance Levels: $28,000, $29,000, $30,000
Support Levels: $19,000, $18,000, $17,000
The daily chart reveals that BTC/USD couldn’t break the resistance level of $23,500 with the current consolidation pattern once again as it fails to cross above the 9-day moving average. The Bitcoin (BTC) begins the day off by trending higher toward the north only to roll over and fall lower to trade back inside the channel. Similarly, the first level of support could be located around $23,000. Beneath this, support lies at $19,000, $18,000, and $17,000 levels.
Bitcoin Price Prediction: Bitcoin (BTC) May Break to the Upside
However, a break above the upper boundary of the channel may set the Bitcoin price to reach the $24,000 level as the Relative Strength Index (14) moves above the 50-level. On the next positive move, traders can see BTC crossing above the 21-day moving average. Although the candle is still yet to close, it does look that the bulls may end up closing above the 21-day moving average; crossing above the upper boundary of the channel could locate the potential resistance levels at $28,000, $29,000, and $30,000.
BTC/USD Medium-term Trend: Ranging (4H Chart)
Looking at the 4-hour chart, BTC/USD may need to recover above $24,000 and any bullish movement towards the upper boundary of the channel could mitigate the short-term bearish pressure in other to hit the nearest resistance level of $25,000. However, this psychological barrier may be closely followed by the resistance level of $26,000 and above.
On the contrary, the nearest support may come at $23,000, and a sustainable bearish movement can increase the downside pressure and bring the price to the support level of $21,000 and below. Considering that the technical indicator Relative Strength Index (14) on a 4-hour chart is starting to revert to the upside as traders might expect that the bull’s case scenario may come to play.
Bitcoin Alternatives
At the time of writing, the Bitcoin price faces the upside as the king coin moves to cross into the positive side. However, if the price continues to create a bullish movement, traders may witness more of higher levels. Meanwhile, the current performance of BTC is gradual and may inspire more bullish movements. Nevertheless, FGHT is the access token of FightOut, the Web 3.0 fitness app, and gym chain that combines real-life workouts with competing in the metaverse – a global first of its kind. Therefore, the presale still continues and close to $5 million has been raised during this process as investors are expected to invest in the token before the end of the presale.
Fight Out (FGHT) – Move to Earn in the Metaverse

CertiK audited & CoinSniper KYC Verified
Early Stage Presale Live Now
Earn Free Crypto & Meet Fitness Goals
LBank Labs Project
Partnered with Transak, Block Media
Staking Rewards & Bonuses
Join Our Telegram channel to stay up to date on breaking news coverage
Source link


Comments are closed.