
BTC/USD Reclaims and Trades Above $60,000 Level


Bitcoin Price Prediction – November 17
The Bitcoin price bounces off the support at $58,500 to add more than $1000 to gets to the current value.
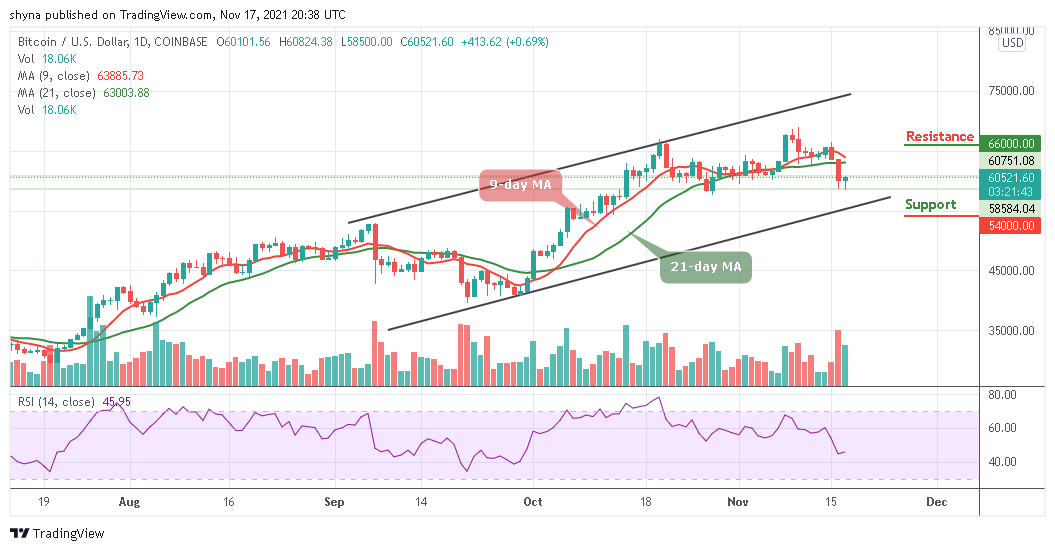
BTC/USD Long-term Trend: Ranging (Daily Chart)
Key levels:
Resistance Levels: $66,000, $68,000, $70,000
Support Levels: $54,000, $52,000, $50,000
BTC/USD is currently trading around $60,521 with a 0.69% gain within the past 24-hour. According to the daily chart, since the beginning of today’s trading, the Bitcoin price fights to stay above the important level of $60,000. More so, for BTC/USD to remain above $60,000 for the past few days, it has made many traders feel that the $58,000 support level could be pretty strong.
Bitcoin Price Prediction: BTC Price May Begin Fresh Bull-Run
The Bitcoin price touches the daily low of $58,500 today, if the number-one crypto breaks below this level, it could test the next support lines at $56,000. Alternatively, Bitcoin has to reclaim the first resistance at $65,000 to head upwards. If successful, the primary cryptocurrency could cross above the 9-day and 21-day moving averages.
However, looking at the technical indicator Relative Strength Index (14) in the daily chart, if the 9-day MA crosses below 21-day MA, BTC/USD is likely to create more downsides. Despite the drop suffered, the RSI (14) is likely to cross above 45-level but before this, there may still be a room that could be explored by the bears. If this happens, the king coin may locate the support level of $54,000, $52,000, and $50,000.

On the other hand, recovery may not come easy as traders must be aware that the first digital asset may need to stay the moving averages to reach the resistance levels of $66,000, $68,000, and $70,000.
BTC/USD Medium – Term Trend: Bullish (4H Chart)
From a technical point of view, looking at the 4-hour chart, the technical indicator Relative Strength Index (14) keeps moving below 40-level and this support the option of some bullish correction. Meanwhile, adding to the above, there is a little bit of bullish divergence on the RSI (14) as the signal line is likely to cross above 40-level to head upward.
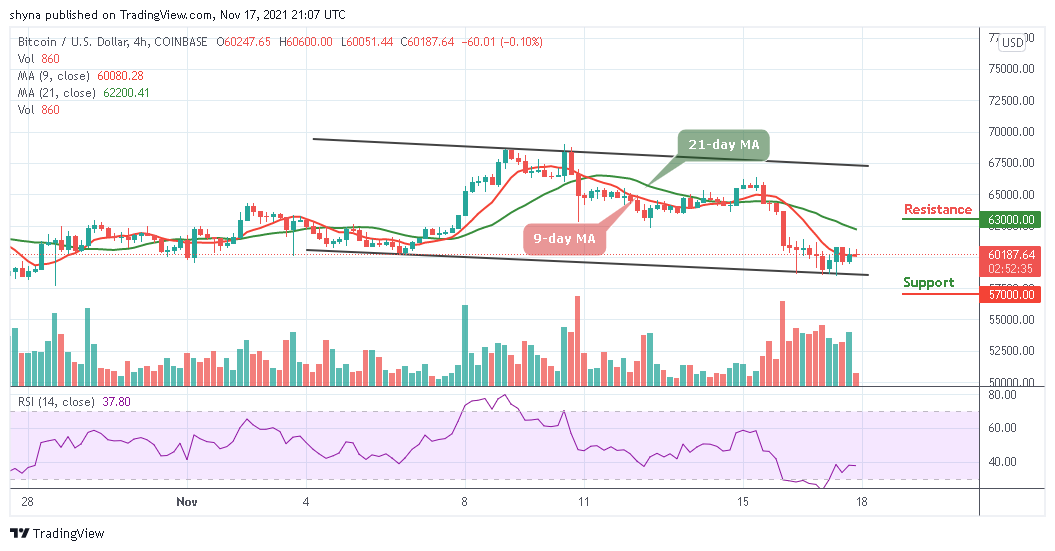
However, if the Bitcoin price breaks above the lower boundary of the channel, the Bitcoin price may likely reach the resistance level of $63,000 and above. On the contrary, if the current market value drops below the lower boundary of the channel, it could slide towards the support level of $57,000 and below.
Looking to buy or trade Bitcoin (BTC) now? Invest at eToro!
68% of retail investor accounts lose money when trading CFDs with this provider
Read more:
Source link