BTC/USD Stays Above $28,000 Resistance

Join Our Telegram channel to stay up to date on breaking news coverage
The Bitcoin price prediction shows that BTC is trading at $28,444 as the king coin is preparing for another spike.
Bitcoin Prediction Statistics Data:
Bitcoin price now – $28,444
Bitcoin market cap – $548.1 billion
Bitcoin circulating supply – 19.3 million
Bitcoin total supply – 19.3 million
Bitcoin Coinmarketcap ranking – #1
BTC/USD Long-term Trend: Bullish (Daily Chart)
Key levels:
Resistance Levels: $32,000, $34,000, $36,000
Support Levels: $24,000, $22,000, $20,000
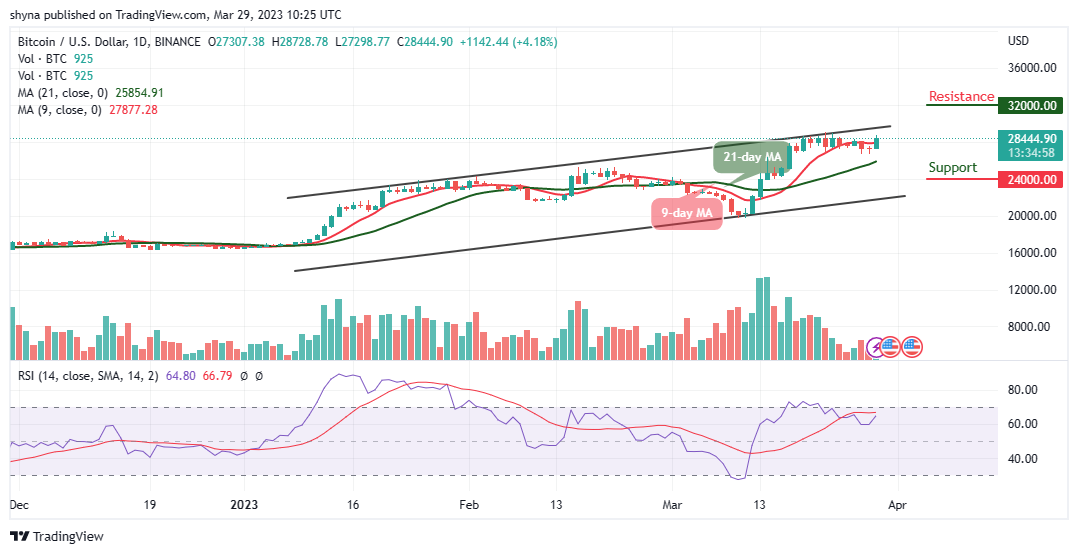
BTC/USD is trading above the 9-day and 21-day moving averages at $28,444 as the king coin prepares to gain additional bullish movement. However, the first digital asset is likely to extend toward the resistance level of $29,000 if the bulls put more pressure on the market.
Bitcoin Price Prediction: Is $30k Resistance Coming for BTC?
At the time of writing, the Bitcoin price is hovering above the 9-day and 21-day moving averages, any further bullish movement above this barrier may locate the potential resistance levels at $32,000, $34,000, and $36,000. However, when new uptrends are gathering, traders may use the 21-day moving average as a pivot resistance point to gauge the strength of the trend. Therefore, if BTC/USD soars above the upper boundary of the channel, this could be a sign of sustainability and could result in a bullish continuation.
On the contrary, if the BTC price fails to move up; traders may see a price cut below the 21-day moving average, and a further low could bring the price to the support levels at $24,000, $22,000, and $20,000 respectively. As it stands now, the Bitcoin price is likely to rise as the technical indicator Relative Strength Index (14) moves to cross above the 70-level.
BTC/USD Medium-term Trend: Ranging (4H Chart)
According to the 4-hour chart, the Bitcoin price continue to move sideways for the past few days and the bulls are trying to come back into the market by keeping the market price above the 9-day and 21-day moving averages. If not, the support level of $25,000 and below may come into focus.
However, if the bulls keep the market above the moving averages, traders may expect a touch of the $29,000 resistance level, and breaking this level may further push the price toward the resistance level of $32,000 and above as the technical indicator Relative Strength Index (14) moves above the 60-level, suggesting bullish movement.
Alternatives to Bitcoin
The Bitcoin price stays above $28k and If the price fails to continue higher, there could be another downside correction and the first key support is near the $26,000 and $25,000 levels. However, the Love Hate Inu development team has already laid out the blueprint for the project’s future and has achieved all the goals for first quarter 2023, including the release of the presale, setting up social media accounts, and making the whitepaper public. Therefore, traders are expected to be part of this as almost $2.5 million has been raised in the ongoing presale so far.
Love Hate Inu – Newest Meme Coin
Decentralized Polling – Vote to Earn
Early Access Presale Live Now
Ethereum Chain
Featured in Yahoo Finance
Mint Memes of Survey Results as NFTs
Staking Rewards
Viral Potential, Growing Community
Join Our Telegram channel to stay up to date on breaking news coverage
Source link


Comments are closed.