
BTC/USD Stays Above $41,000 Resistance Level


Bitcoin Price Prediction – March 9
The Bitcoin price prediction gains 7.92% as bulls keep working hard to nurture a bullish trend from the opening price at $38,749.
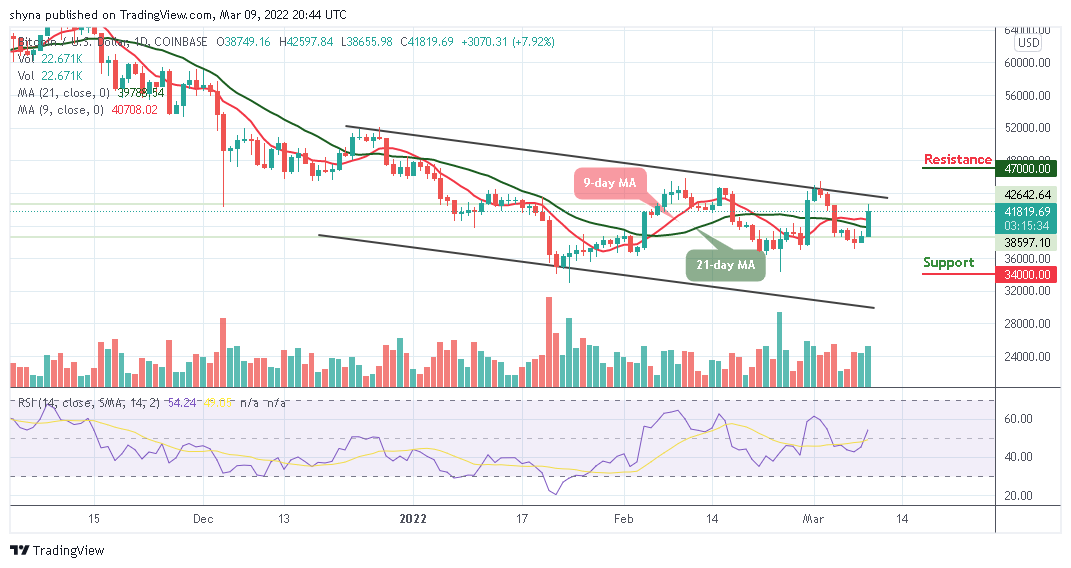
BTC/USD Long-term Trend: Ranging (Daily Chart)
Key levels:
Resistance Levels: $47,000, $49,000, $51,000
Support Levels: $34,000, $32,000, $30,000
BTC/USD is trading at the $41,819 resistance level above the 9-day and 21-day moving averages after the king coin touches the daily high at $42,597. For the past few days, the Bitcoin price has been towards the south, and in the context of this; an upward movement towards the resistance level of $45,000 is expected.
Bitcoin Price Prediction: Will BTC Break Above $45,000 Resistance Level or Reverse?
If the Bitcoin price can continue the upward movement above the moving averages, it is likely for the market price to touch the $43,000 level. This is where traders should expect buyers to fight for a further rise in BTC/USD. However, the purpose of this movement is to provide a resistance level that is close to $44,000 as the technical indicator Relative Strength Index (14) moves to cross above 50-level.
Looking at the daily chart, BTC/USD may experience a quick retracement or sell-off just in case it touches the crucial $43,000 level but if not; traders may see additional resistance levels of $47,000, $49,000, and $51,000 above the upper boundary of the channel. On the downside, if the market decides to fall, the price of Bitcoin could fall below the moving averages, and if that support fails to hold the sell-off, BTC/USD could see a further decline towards the support levels of $34,000, $32,000, and $30,000.

BTC/USD Medium – Term Trend: Ranging (4H Chart)
On the 4-hour chart, traders expect the coin to gain the lost momentum and could hit the trade above $42,000. On the contrary, if the selling pressure still exists and holds the coin not to be able to move towards the upper boundary of the channel, the $39,000 and below may come into play.
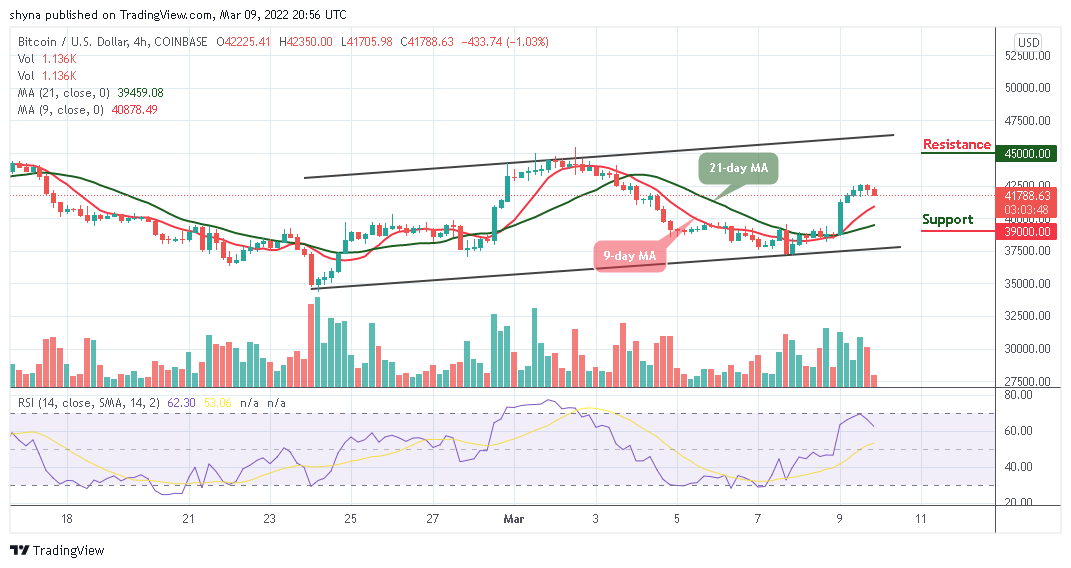
However, in as much as the buyers keep the price above the 9-day and 21-day moving averages, traders may expect a strong bullish movement that could hit the resistance at $45,000 and above. Meanwhile, the technical indicator Relative Strength Index (14) is likely to cross below 60-level, suggesting that a bearish signal may come into focus.
Looking to buy or trade Bitcoin (BTC) now? Invest at eToro!
68% of retail investor accounts lose money when trading CFDs with this provider
Read more:
Source link


Comments are closed, but trackbacks and pingbacks are open.